Rethink Your Branding to Create Crazy Love From Customers
A company can exist to merely sell stuff and make money. And, certainly, many do.…
Let’s Go Mets! Let’s Go Mets! Okay, now that I got that out of the way, the real stuff: With the World Series approaching (Let’s Go Mets! …huh, maybe it wasn’t all out of the way) it means it’s also the time of year for media pundits to be talking about exactly how many people are watching these massive sporting events. Because the World Series sure gets the attention of a lot of people. But in this day and age, many of us wonder just where that attention really is, and how much we should be paying to capture some of it.
Recently, David Pakman authored a well-circulated article called “May I Have Your Attention, Please?” dedicated to pointing out shifts in “millennial” viewing behavior. And when it comes to his perspective on attention, Dave and I are in lockstep — for the first paragraph at least.
That first paragraph states that attention should be the currency we use as an industry, and recognizing it as such is hugely important for anyone in the advertising, media, or content business. That’s spot-on.
But then David falls into a common trap of comparing apples and oranges when dealing with the various proxies for attention across various mediums — specifically, what are favorably called “views” in the digital parlance and “audience” in TV. And this mistake leads to some very skewed, and very wrong, conclusions.
Now, before I go any further: Yes, everything is changing. No, I am not a grumpy old man yelling “get off my digital lawn” (in fact, I technically do — though barely — qualify as one of those “damned millennials”). But if we are going to have a real dialog about shifts in attention, I do think we all need to have a better understanding of the metrics that various mediums use and how different they are from one another.
The crux of almost everybody’s misunderstanding of “TV” audience measurement vs. digital “views” can be summed up in one graph from David’s post called “Audience Size of Media Platforms and Properties.”
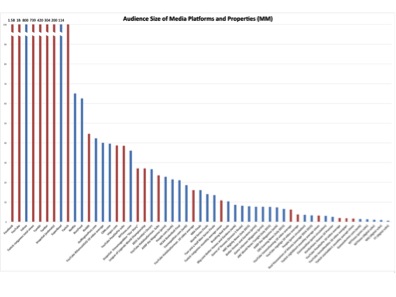
Source: David Pakman
At one end are the reaches of Facebook, YouTube, and Snapchat, so big they don’t even fit on the graph. At the other end is a whole lot of traditional mainstream entertainment — nightly news shows and TV premieres, for example, comparatively tiny in size. The conclusion we’re supposed to draw is that there is an enormous shift in where our attention is spent and that the old way of thinking about it is slowly dying off. (Again, yes, it is, but just not in the way we think. That’s a story for another day.)
Here’s the problem: The “audience sizes” in the chart are, by and large, totally incomparable to one another. Some assess monthly active users. Others are view counts. Others are free subscriber counts. None of these are the same thing, and putting them side-by-side can get us to some misleading conclusions.
Why is this important? Because if we’re understanding this stuff wrong, we’re not adequately assessing where human attention is spent, and how much of it is available for advertisers.
Let’s compare two of the items in Pakman’s chart, since Pakman himself calls it out: Last year’s World Series Game 7, and a YouTube sensation who goes by HolaSoyGerman. Both are shown to have an “audience reach” of about 14 million people.
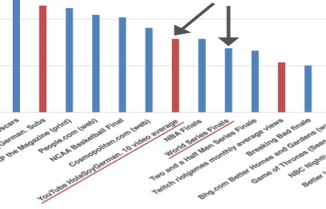
Right off the bat (pun intended), that’s a lot fewer people than actually watched Game 7 — it was more like 23.5, according to Nielsen, but the 14-million-ish represents the coveted 18–49 demographic, so let’s roll with that. And a few bars over in the chart, the average number of video views that the YouTube sensation gets is also listed at about 14 million (not using 18–49 here).
This, according to Pakman, is the kind of example that shows how audience sizes of non-traditional media are usurping those of even the most universally mainstream of “traditional” media.
But let’s look at what those numbers actually mean. 14 million views of a YouTube video? Impressive. But, these are not viewers; they are views. And, a reminder, users don’t have to have watched the whole thing in order for a “view” to be counted. But let’s lovingly assume that everyone of those “views” is from a unique viewer, and that everyone of those viewers watched the entire thing. HolaSoyGerman’s average video is about 5 minutes long; multiply that by 14 million, and that’s a total of 70 million minutes spent watching one of his videos. And it’s total, not simultaneous or all on a given day.
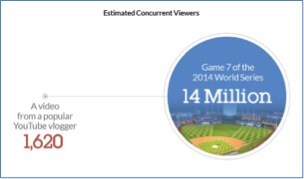
So let’s say those 14 million views were all amassed in a month (which seems about the case). 1 month is 30 days, there are 24 hours in a day, and there are 60 minutes in an hour. That’s 43,200 minutes in a month. Divide the 70 million minutes by that figure, and you get slightly over 1,620. So at any given moment, that YouTube video is likely being watched by about 1,620 people.
Game 7 of the World Series, meanwhile, had 14 million unique human viewers (just between the ages of 18–49) in the United States. At every single minute. For its entire two and a half hours. These two pieces of content — a HolaSoyGerman video versus Game 7 of the World Series — just aren’t comparable in this way. This isn’t just comparing apples with oranges; it’s comparing apples with baseball-stadium-sized oranges.
So, on Pakman’s chart, it looks like these two things have the same audience, but in another chart, I could say that this is the comparative scale should look more like this to an advertiser:
And I still haven’t limited the YouTube video’s to the “reach” that matters — as the TV audience is — namely: only uniques, or to 18–49, or to just the U.S., or multiplied by the potential ad load of each (since that is what advertisers buy!!) The chart difference would be so ridiculous that it wouldn’t fit on your screen.
I am not saying YouTube isn’t a huge, game-changing deal. It is. I am not saying YouTube sensations aren’t real sensations. They are. But we can’t even have a conversation about what is really happening with people’s attention, or relative value, if we aren’t talking in the same terms.
Now, you can say that Nielsen panel data can be inaccurate. And I can grant that, but why question Nielsen’s accuracy without questioning the accuracy of YouTube view counts?
I mean…
You could say that some of the people counted as World Series viewers might have been in bars where they weren’t actually paying attention. But again, how is this different from someone who might be distracted by another browser window (or another device) while watching a YouTube Video? We don’t even require that an online “view” takes up the entire screen, or is in the viewable screen for the entire duration, like we do with TV. And as GroupM’s Rob Norman has pointed out, we compare digital video metrics without even taking into account some of the most basic differences between platforms, like whether a video is user-initiated or autoplays.
Now, since I am full-on sounding like a cranky TV guy trying to fight the tides of change — and I can promise you that is not my intention — I am going to stop arguing and just leave you with the numbers to start a conversation. This, I hope, shows that we need a universal measure of attention, or potential attention, or at least some proxy for likelihood of real human attention, especially in our increasingly platform-fragmented world. We’re rigging the metrics game, and it’s hard to play fair when the rules are different. (Like giving the American League a designated cheater…whoops, I mean designated hitter. Let’s Go Mets!) If we just set the same rules, then we will have an easier time, seeing how things are really changing.
And having that universal measure of human attention starts not by using the biggest, most eye-popping numbers we can get our hands on; it starts with a universal understanding of what those numbers are really telling us.